Piping Systems FluidFlow3 - Gas, Compressible Flow

When a gas flows in a pipe network the gas density, temperature and velocity change as the fluid flows through the network.
A solution approach often used in the literature is to assume ideal gas laws so that analytical equations for energy, momentum and continuity equations can be derived. Rather than make these simplifying assumptions FluidFlow3 uses a calculation procedure that solves the conservation equations together with an equation of state for small pressure loss increments. This means FluidFlow3 obtains a rigorous solution.
Available equations of state are:
Compressor Room Dynamic Scenario

|
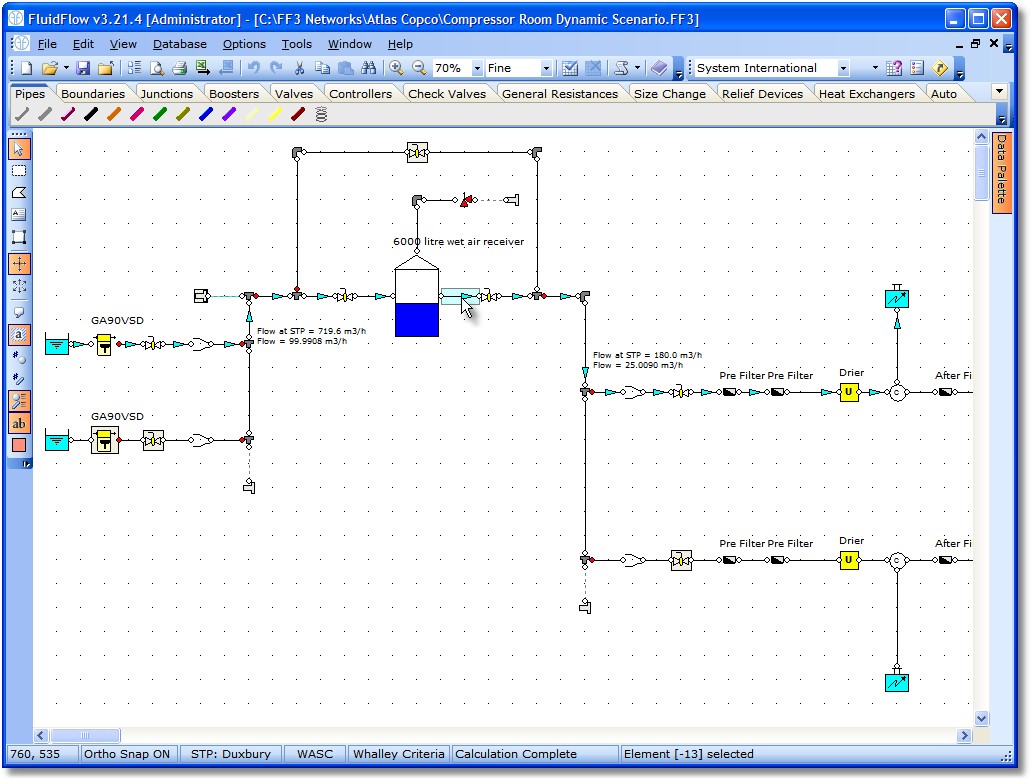
The example to the left shows an air compression and receiver system.
PD Compressors, Air Filters, Recievers, Driers and Relief Systems can all be included in the same model.
Dynamic scenarios are best considered using script, but of course alternate design scenarios can be considered via the Input Editing facilities available with all versions and modules.
|
Gas Results

|
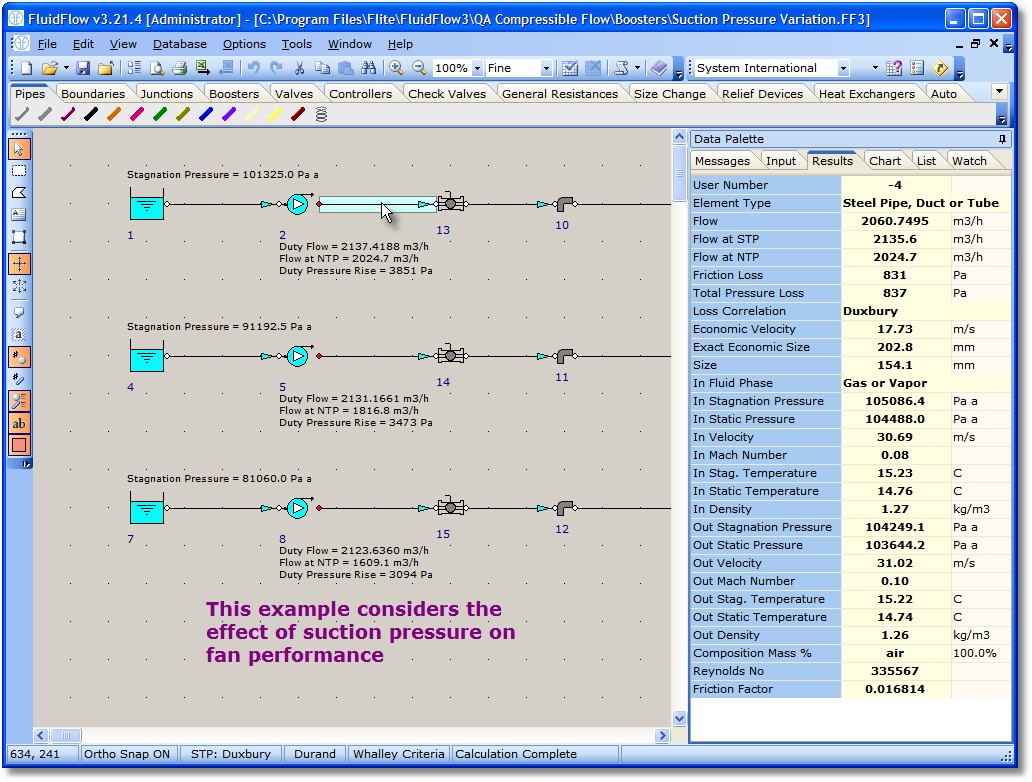
Consider the tabular results for the fan discharge pipe as shown opposite. Along the flowpath the gas expands, the temperature and density decreases, while the velocity and actual flow increases. This is the case if no heat transfer occurs, FluidFlow3 can also take heat transfer considerations into account.
You may also notice that we are displaying 3 volumetric flows in the results table. The first flow refers to the actual flow at the start of the pipe (remember the actual volumetric flow increases as gas flows down the pipe), the other flow rates show volumetric flow with reference to standard and normal conditions.
|
Gas Chart Results

|
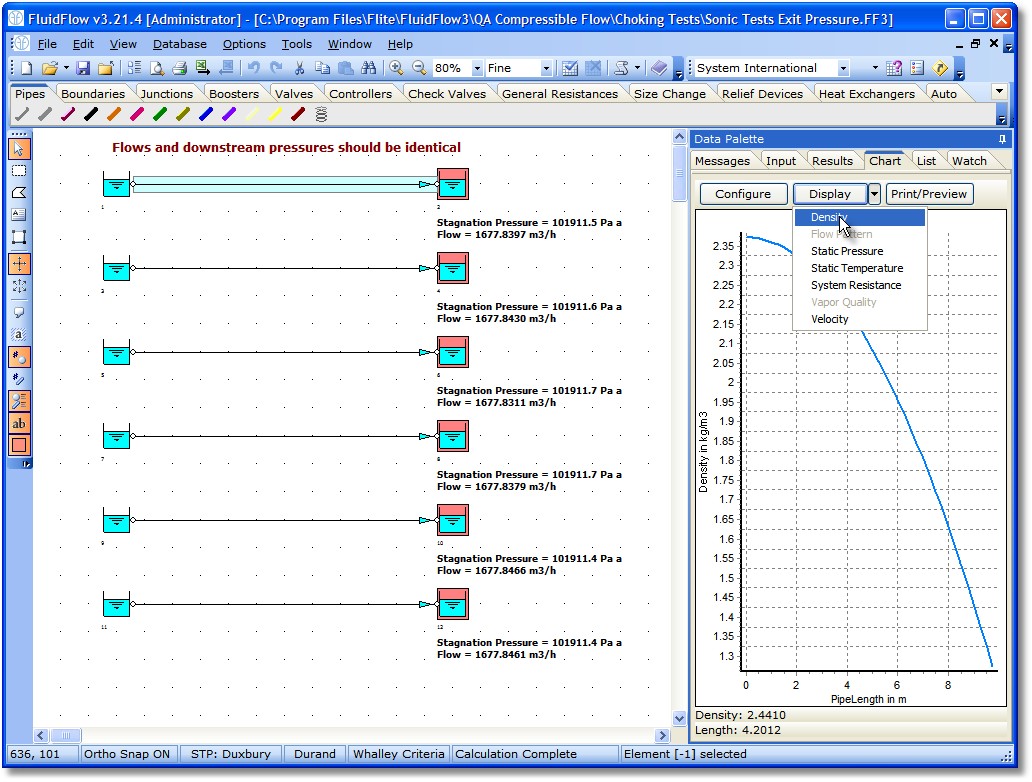
For gas flow within a pipe, the pressure and temperature conditions continuously change. This means that the gas physical properties of density, viscosity, heat capacity, thermal conductivity, sonic velocity, etc., change with pipe length.
The curve opposite shows the change in gas density as we flow down this pipe. This underlines the importance of using an appropriate calculation method. Imagine the error that would be introduced if you assumed density was constant.
|
| 


