Piping Systems FluidFlow3 - Two Phase Liquid-Gas Flow

The two phase flow module allows two phase liquid-gas calculations to be accomplished. Two phase flow occurs in many industrial processes. Examples are petroleum, chemical, nuclear, refrigeration, space, and geothermal industries.
FluidFlow3 can analyse systems where the vapor quality changes with pipe position as well as two phase flow where the vapor quality is fixed.
FluidFlow3 uses a modelling approach for the pressure loss calculation, this is a hybrid between the rigorous and empirical methods. By this, we mean, that we use well known empirical correlations and apply them to a differential pipe length. This allows for a flash calculation, liquid holdup and flow regime to be determined for each segment and acknowledges that the pressure loss per unit length changes as the two phase mixture flows down the pipe.
The available pressure loss relationships that you can use in FluidFlow3 are:
- Friedel: This method is based on the paper published by Friedel and utilises a two phase multiplier to the liquid pressure loss calculation.
- Chisholm: Proposed an extensive empirical method (1973), which also uses a two phase multiplier.
- Lockhart-Martinelli: Proposed a separated flow model, but this should only be applied to horizontal flow.
Comparison of the above 3 methods to a recent two phase database was made by Whalley who made the following recommendations:
(µL<µG) < 1000 and a mass flux of < 2000 kg/m2s use the Friedel method.
(µL<µG) > 1000 and a mass flux of > 100 kg/m2s use the Chisholm method.
(µL<µG) > 1000 and a mass flux of < 100 kg/m2s use the Lockhart Martinelli method.
If you select the Whalley Criteria in the Calculation Options dialog. FluidFlow3 will select the appropriate method for you.
- More recently Muller Steinhagen and Heck (2000) made an updated comparison and recommended the MSH correlation as a better approach, particularly for refrigerants and single component fluids. This method looses accuracy at high vapor quality.
- One of the first approaches based on flow regime was made by Beggs Brill. This correlation is applicable to all pipe orientations. The original method (1973) was extended and FluidFlow3 uses the extended method. You should probably not use this method for vertical upflow because it underpredicts pressure loss.
- Drift Flux modelling is accommodated in FluidFlow3 by using a new correlation published in 2007 [22], this model is best suited for vertical and inclined pipes.
Two phase input data

|
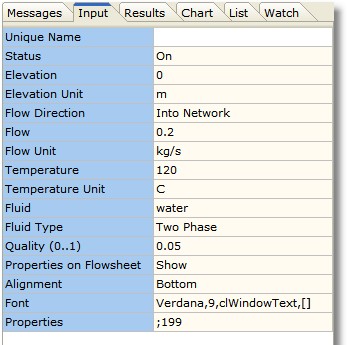
The example opposite shows the Input Editor defined for the supply of a two phase mixture of steam and water fed directly into a network.
FluidFlow3 will calculate the change in vapor quality as the two phase mixture flows down the pipe.
FluidFlow3 also allows multiphase mixtures to be made via the flowsheet.
|
Two fluids mixed on a flowsheet

|
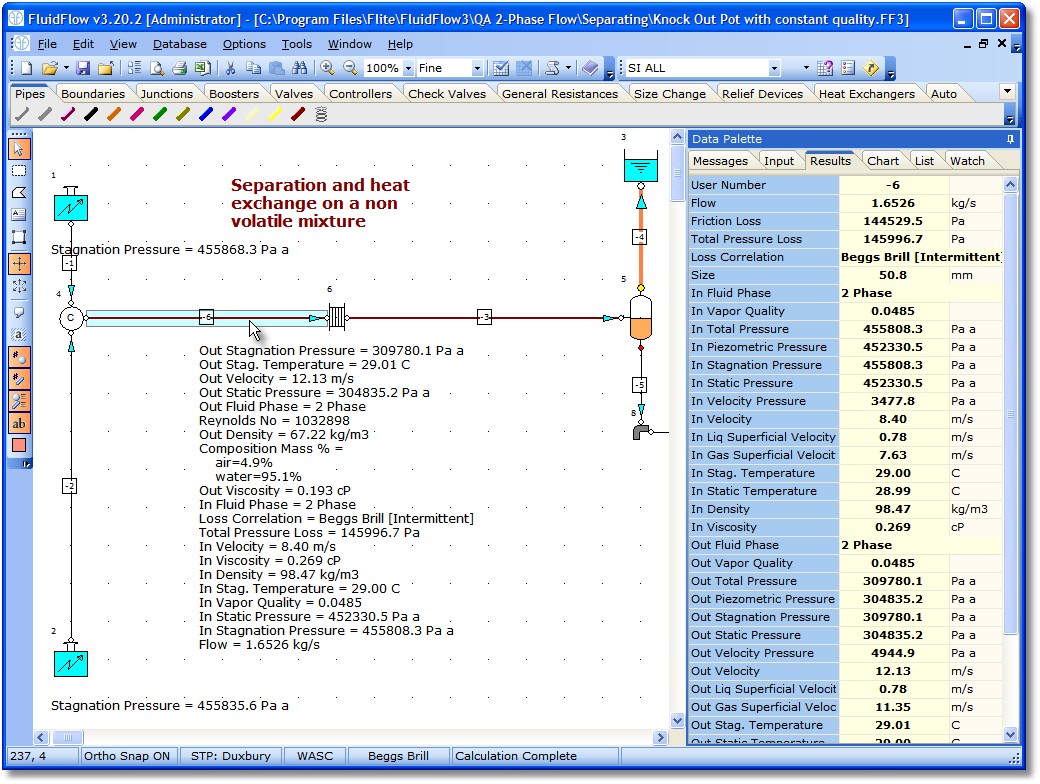
The flowsheet shows two known flows (one fluid air(2), one fluid water(1)) combining and being heated via a plate exchanger, then flowing to a separation vessel (5). The red dot on the Knock Out Pot (separator) represents the liquid outlet and the yellow dot represents the vapor outlet.
This is an example of two phase flow with constant quality. This means that the vapor mass fraction is constant and there is no mass transfer between the phases. It does not mean that the pressure loss per unit length is constant or that the velocity between the two phases is constant. In the first pipe section after mixing (pipe -6) you can see that the gas superficial velocity increases from the start to the end of pipe -6. For 60m of pipe -6, the total pressure loss is 145997 Pa, but the friction loss is 144529 Pa. Since the pipe is horizontal the difference is the acceleration loss.
|
Pipeline flow pattern map for two phase flow

|
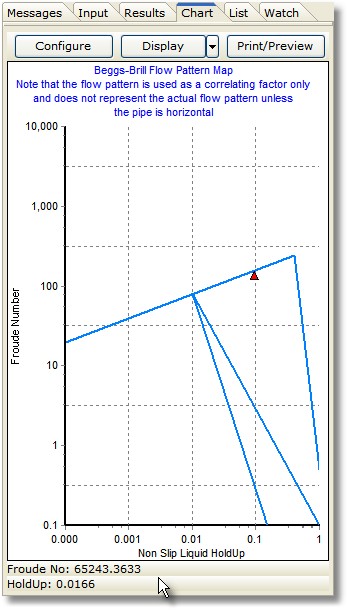
The horizontal flow pattern map for the Beggs and Brill method is shown opposite. This correlation is applicable to the entire range of pipe inclination angles, although it usually underpredicts pressure loss for vertical upward flow.
In this example the predicted flow pattern is in the intermittant region.
Using a mechanistic modelling approach a more accurate model of the flow pattern map can be achieved.
|
Separation from a boiling mixture

|
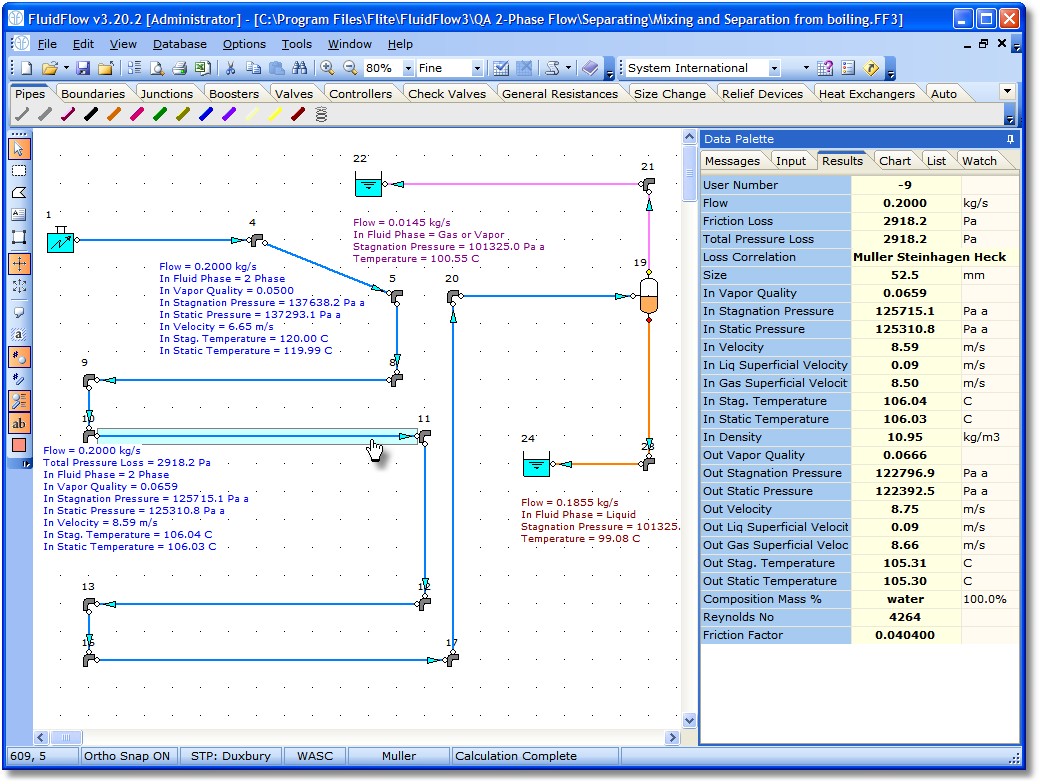
This example shows a boiling mixture of steam and water flowing through a pipe network to a vapor-liquid separator. The calculated results have been exported to Excel. The content of the export can be controlled.
You can download the xls file produced by FluidFlow3 by clicking here.
|
| 


